

WPMC Behavior and Heatmap
WPMC Behavior & Heatmap helps WordPress site owners understand how visitors interact with their pages by tracking clicks, heatmaps, page views, referrers, referral sources, scroll depth, sessions, users mouse movement, and key engagement metrics.
The plugin turns visitor behavior into clear visual and statistical reports directly inside the WordPress admin panel, making it easier to analyze page performance, review mouse trails before important clicks, understand traffic sources, improve navigation, identify popular elements, and optimize content or conversion points based on real user activity.
 Releases
3
Releases
3
 Version
1.9.0
Version
1.9.0
 Requires WP
6.0
Requires WP
6.0
 Requires PHP
8.0
Requires PHP
8.0
 Tested up to
7.0
Tested up to
7.0
Older plugin versions:

WPMC Behavior & Heatmap: understand clicks, movement, sources, scroll depth, and visitor paths inside WordPress
WPMC Behavior & Heatmap is a WordPress admin plugin for seeing what visitors do after they land on a page. It combines click heatmaps, page-level behavior details, User Mouse Trails replay, Referral Sources, scroll depth, sessions, live visitors, source performance, user flow, and clean maintenance tools in one dashboard.
The plugin is built for site owners, marketers, agencies, UX reviewers, content teams, and technical WordPress administrators who need more than pageview totals. It shows which pages attract attention, which clicks lead somewhere, which clicks look like conversion intent, which sections are ignored, where visitors came from, and where they went next.
Search & Social Overview
Scroll Depth Distribution
Total views 743Drop-off: Left near the top – 413 (56%).
A complete behavior workflow, not a single chart
The plugin tracks several connected signals. A click tells you where the user acted. A heatmap shows the pattern. Scroll depth shows how far the page held attention. Referral data explains arrival context. User flow reveals the next step. Mouse movement shows the few seconds before a conversion or a confusing dead click.
Heatmap Page List
Browse tracked URLs with views, unique users, direct/internal/external traffic, clicks, navigation clicks, and conversion clicks.
Heatmap Details
Open a page report with a live page preview, click dots, heat mode, device filters, scroll distribution, and page controls.
User Mouse Trails
Review short pre-click cursor trails for desktop conversions and dead clicks without storing form values.
Referral Sources
See how visitors reached a specific page and where they continued in the same session.
Statistics
Review pageviews, unique users, sessions, time on page, average session duration, device distribution, and referral charts.
Analytics
Use source performance, user flow, top paths, top exits, and behavior opportunities to decide what needs attention.
Live Visitors
Show online users and the pages active visitors are viewing from heartbeat data.
Settings and Cleaning
Control post types, tracking switches, mouse trail mode, excluded IPs, batching, compression, and data cleanup.
Four data families power the reports
WPMC Behavior & Heatmap is easier to understand when the data model is clear. The plugin uses separate tables for page views, sessions, click events, and mouse trails, which keeps each report focused.
Start from a sortable list of tracked pages
The Heatmap Page List is the operational entry point. It aggregates each tracked URL and shows views, unique users, direct traffic, internal traffic, external traffic, total clicks, navigation clicks, and conversion clicks. You can filter by public post type, taxonomy, term, search query, and date range.
- Use page type, taxonomy, term, search, and date filters to narrow large datasets.
- Sort by traffic, source mix, click volume, navigation, or conversions.
- Open any row to inspect the page-level behavior details screen.
- Keep reports responsive with SQL aggregation and paginated results.
Open a page and inspect clicks on top of the real layout
The page details screen loads the selected page in a preview iframe and overlays the behavior layer. Click mode shows individual points. Heat mode shows dense interaction zones. The same screen also reports non-navigation clicks, navigation clicks, and conversion clicks.
- Review Click mode when you need exact interaction points.
- Use Heat mode when you need a fast pattern read.
- Switch device context between mobile, tablet, desktop sizes, and summary views.
- Toggle fixed clicks and all-time data when layout behavior needs a different lens.
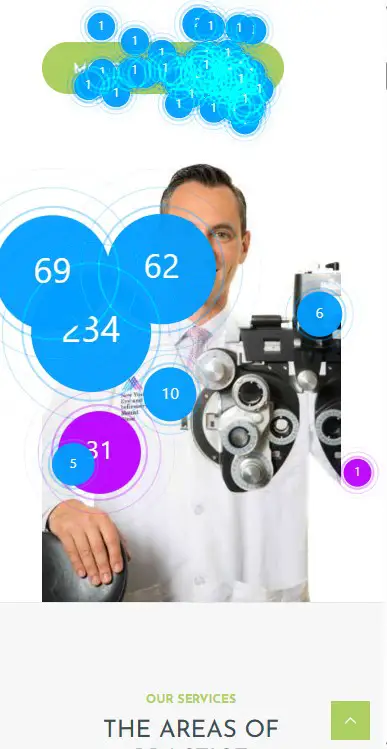
Heatmap mode turns raw clicks into readable behavior density
Heatmap mode helps you stop scanning rows and start seeing the page. Dense zones show where attention and interaction gather. Quiet areas show content that may be skipped, misplaced, or visually weak.
- Find strong and weak sections on landing pages, service pages, product pages, and content hubs.
- Compare expected action areas with actual user behavior.
- Use heat intensity to support layout, copy, and CTA tests.

Behavior changes by viewport, so the report separates devices
The details screen includes device controls and scroll depth reporting. That matters because a desktop visitor, a tablet visitor, and a mobile visitor can interact with the same page very differently. The plugin can show scroll milestones, drop-off notes, and full-page completion in the context of the selected device family.
- See reached halfway, reached full page, and biggest scroll drop-off.
- Switch between mobile, tablet, desktop S, desktop M, desktop L, and summary.
- Use scroll data with click data to understand whether visitors saw the important section before clicking.
Scroll Depth Distribution
Total views 743Drop-off: Left near the top – 413 (56%).
User Mouse Trails is a separate page for pre-click movement replay
User Mouse Trails is not the same report as Referral Sources. It is a dedicated page details tab for replaying short desktop cursor trails before selected clicks. By default, the tracker focuses on conversions and dead clicks, because those are the interactions where pre-click behavior is most useful.
See hesitation, direction, and confusion before the final click
A click coordinate tells you where the click happened. A short cursor trail tells you how the visitor approached that click. That can reveal uncertainty near a CTA, searching behavior around a form, a repeated dead-click zone, or a navigation element that looked clickable but did not respond.
- Replay a selected trail on top of the page preview.
- Review Total trails, Conversions, Dead clicks, and selected desktop viewport.
- Open Recent Trails to compare capture type, duration, point count, selector, and timestamp.
- Use Capture Logic to explain when movement is stored and when it is discarded.
Privacy-aware by design
The settings page describes User Mouse Trails as short pre-click cursor trails. Trails store coordinates and timing only, not form values. The tracker keeps a short in-memory ring buffer, sends a trail only when the capture rule matches, and then discards the movement history.
- Default mode: Conversions + dead clicks.
- Optional modes: Conversions only, or conversions + dead clicks + sampled regular clicks.
- Configurable trail window and sample interval.
- Desktop replay viewports: Desktop S, Desktop M, Desktop L.
Referral Sources is a separate page for arrivals and next-page movement
Referral Sources is not a mouse replay screen. It is a dedicated page details tab for understanding how visitors reached the current page and where they went next. It works from view and session data, grouping direct traffic, internal referrals, external referrals, and next pages.
Know whether page behavior matches visitor intent
A page can behave differently depending on source. Visitors from an internal product page may be ready to compare details. Visitors from an external article may need more context. Direct visitors may already know the brand. Referral Sources gives that context at the page level.
- Count direct views with no recorded referrer.
- List internal pages that sent visitors to the current page.
- List external websites that sent visitors to the current page.
- Show where visitors went next in the same session.
- Open the wider Analytics report with the same page and date context.
Source performance
Referral Sources
Dedicated source and next-page report for the selected page and date range.
Recent updates make the plugin more useful for real diagnostics
The current plugin build adds deeper page-level behavior screens, mouse trail capture, stronger referral and next-page reporting, faster indexed queries, and more practical analytics output for growing WordPress sites.
-
User Mouse Trails replay.
A dedicated details tab can replay short pre-click cursor trails for desktop conversions, dead clicks, and optional sampled clicks. -
Referral Sources tab.
A separate details tab shows Direct, Internal, External, and Next pages without mixing the source report with mouse movement. -
Page hash and performance indexes.
Click and mouse trail queries use page hashes and date indexes to keep large reports more responsive. -
Behavior opportunities.
Analytics can highlight shallow scroll depth, low time on page, missing CTA interaction, and click friction signals.
Use site-wide statistics when you need the broader traffic view
Statistics gives a wider reporting layer for pageviews, unique users, sessions, average session duration, time spent on pages, device distribution, referrals from search and social sources, and top pages by views. It complements the page-level heatmap workflow.
- Switch between summary cards and chart details.
- Review views, users, sessions, device type, time, and top pages.
- Track search and social referral trends with dedicated charts.
- Open the Analytics screen from live visitor and referral context.
18 active last 30 minutes
Referrals by Source
Ranked by sessions in the selected period.
Unique Users
1877Total Sessions
1996Total Views
2454Avg. Time on Page
8 m 48 sAvg. Session Time
2 m 50 sReferrals from Search/Social
913Device Type Distribution
2454Top 10 Pages by Views
Top 10Turn behavior data into decisions, not just dashboards
The Analytics screen combines local behavior data with decision-oriented summaries: sessions, pageviews, unique visitors, total clicks, conversion clicks, average scroll depth, user flow, top paths, top exits, source performance, and behavior opportunities.
- Use User Flow to see entry pages and the next steps visitors take.
- Use Top Paths to understand common multi-page journeys.
- Use Top Exits to find pages where sessions often end.
- Use Source Performance to compare traffic sources by pageviews, unique visitors, and average scroll depth.
- Use Behavior Opportunities to prioritize pages that may need content, UX, or conversion review.
User Flow
Entry pages and the next steps visitors take during the selected period.
Entry page
Next page
Third page
Fourth page
Most common moves
Top Paths
Top Exits
Online users
The plugin stores live heartbeats while the visitor tab is visible and can report active visitors plus the top pages they are viewing now.
WPMissionControl integration
REST endpoints expose behavior status and summary data when a valid integration token or admin capability is available.
Data cleaning
Admins can clear click, view, session, and mouse trail data, delete older records, optimize tables, or remove page-specific data from the details screen.
Where each function lives in the WordPress admin
The plugin is organized as a WPMC admin area. The Dashboard is a hub, and the detail pages split heatmaps, User Mouse Trails, and Referral Sources into separate tabs.
Tracking is configurable
Admins can turn the click tracker on or off, enable or disable User Mouse Trails, choose the mouse trail capture mode, set the trail window, set the sample interval, choose tracked post types, exclude IPs, and tune batching or compression.
- Tracking skips admin users where the plugin marks them as admins.
- The front-end view tracker ignores likely bots and iframe views.
- Excluded IP rules can prevent internal traffic from being tracked.
- Tracked post types limit which public content types are included.
Reports are built for growing datasets
The plugin uses batching, optional compression, rate limits, payload size limits, indexed tables, page hashes, and cleanup tools. That matters because behavior analytics can grow quickly on active sites.
- Click ingest batches events and can use REST or beacon delivery.
- Mouse trails are limited by payload size, point count, and rate limits.
- Data Cleaning can clear tables, delete older data, optimize tables, or delete per-page records.
- Analytics reads are limited and summarized to keep admin pages useful.
How teams use WPMC Behavior & Heatmap
-
Find the page
Start in the Heatmap Page List and sort by views, external traffic, click volume, or conversion clicks.
-
Inspect interaction
Open details and review click dots, heat density, navigation clicks, conversion clicks, and scroll depth.
-
Replay intent
Use User Mouse Trails to inspect hesitation or confusion before conversion and dead-click events.
-
Check source context
Use Referral Sources to understand how visitors arrived and where they moved after the current page.
-
Review flow
Use Analytics to compare user flow, top paths, top exits, and source performance across the site.
-
Prioritize fixes
Use behavior opportunities to decide which pages need UX, copy, source, or conversion review first.
-
Test changes
Adjust layout, calls to action, navigation, or opening content, then compare later behavior data.
-
Keep data clean
Use Settings and Data Cleaning to control scope, remove old records, and keep reporting manageable.
Frequently asked questions
Is User Mouse Trails the same as Referral Sources?
No. User Mouse Trails is a page details tab for cursor trail replay before selected clicks. Referral Sources is a page details tab for direct, internal, external, and next-page traffic analysis. They use different data and answer different questions.
What does User Mouse Trails store?
It stores short desktop cursor trails before matching click events. The settings screen describes the data as coordinates and timing only, not form values. Capture modes include conversions only, conversions plus dead clicks, and conversions plus dead clicks plus sampled regular clicks.
What does Referral Sources show?
Referral Sources shows direct views, internal referrers from the same site, external referrers from other websites, and pages visitors opened next in the same session.
Can the plugin separate normal clicks from conversions?
Yes. The click tracker stores regular clicks, navigation clicks, and CTA-style conversion clicks. The tracker detects many common button, form, contact, booking, checkout, and submit patterns.
Does the plugin support different devices?
Yes. Heatmap reports can be filtered by mobile, tablet, desktop S, desktop M, desktop L, and summary. User Mouse Trails focuses on desktop replay viewports.
Can admins control what gets tracked?
Yes. Settings include the main click tracker switch, User Mouse Trails switch, mouse trail capture mode, tracked post types, excluded IPs, batch size, max delay, compression, and heatmap bucket size.
Can old behavior data be removed?
Yes. The Data Cleaning screen can clear click, view, session, and mouse trail tables, delete older data by date, optimize tables, or delete page-specific data from the details screen.
Does WPMC Behavior & Heatmap integrate with WPMissionControl?
Yes. The plugin can read a WPMissionControl API key automatically when available or use a manual fallback. It exposes behavior status and summary REST endpoints for WPMissionControl-compatible reporting.
Final thoughts
WPMC Behavior & Heatmap is built for people who want to improve WordPress pages with real behavior evidence. It does not stop at pageviews. It shows clicks, heatmaps, movement before key clicks, referral context, scroll depth, session paths, live visitors, and data-driven opportunities inside the WordPress admin.
Use it when you need to understand why a page is not converting, why visitors stop scrolling, which sources bring useful traffic, where users go next, and which parts of a page deserve the next round of improvement.