
Preview the WPMC Behavior & Heatmap Dashboard
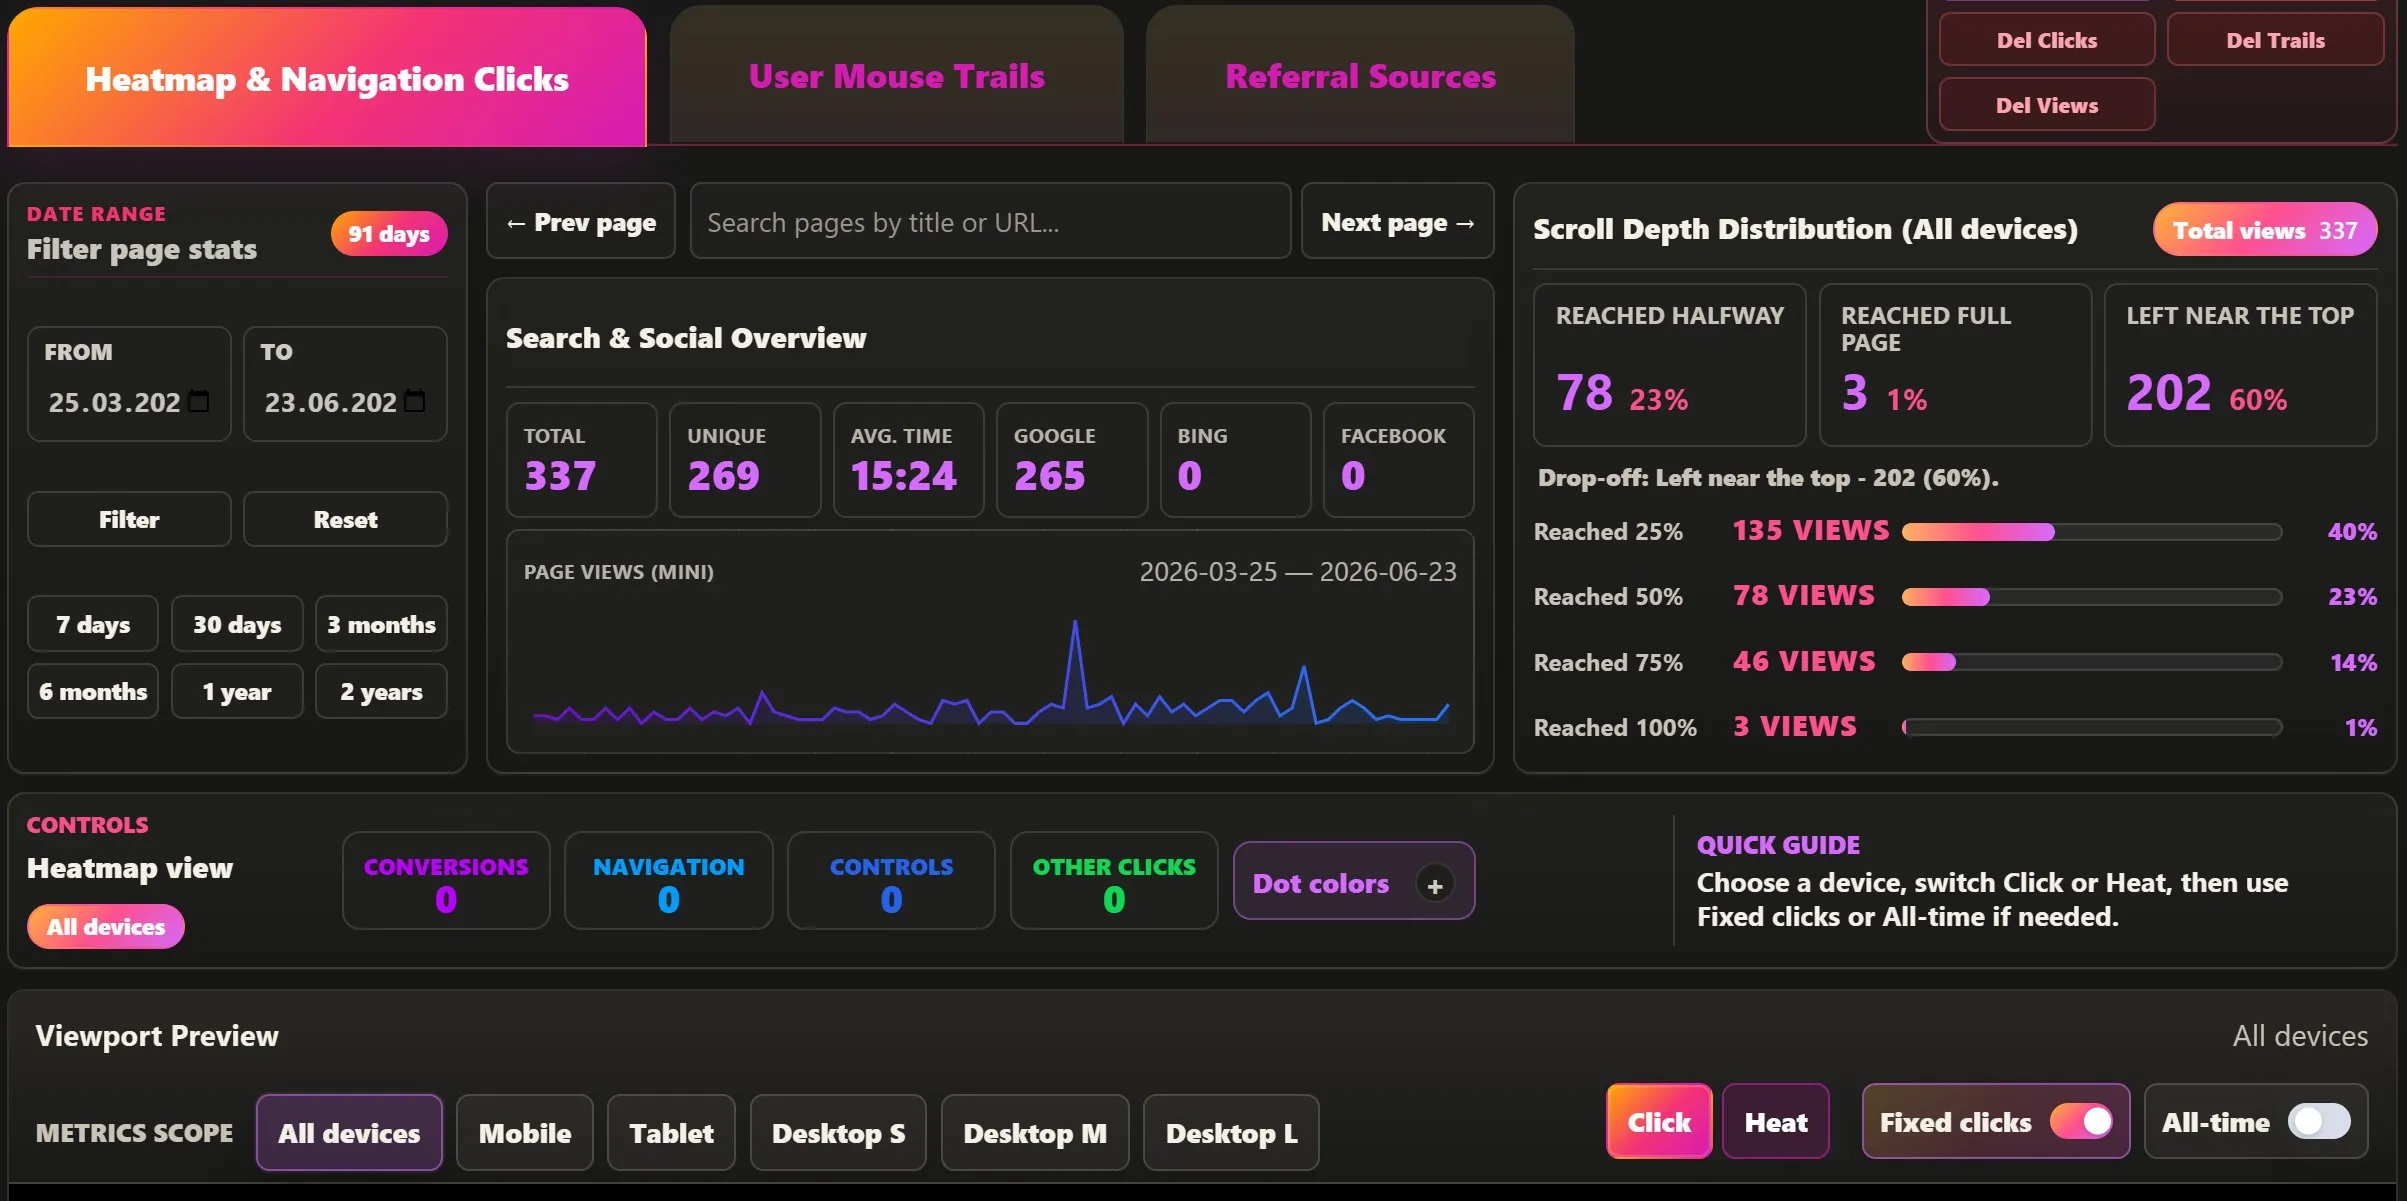
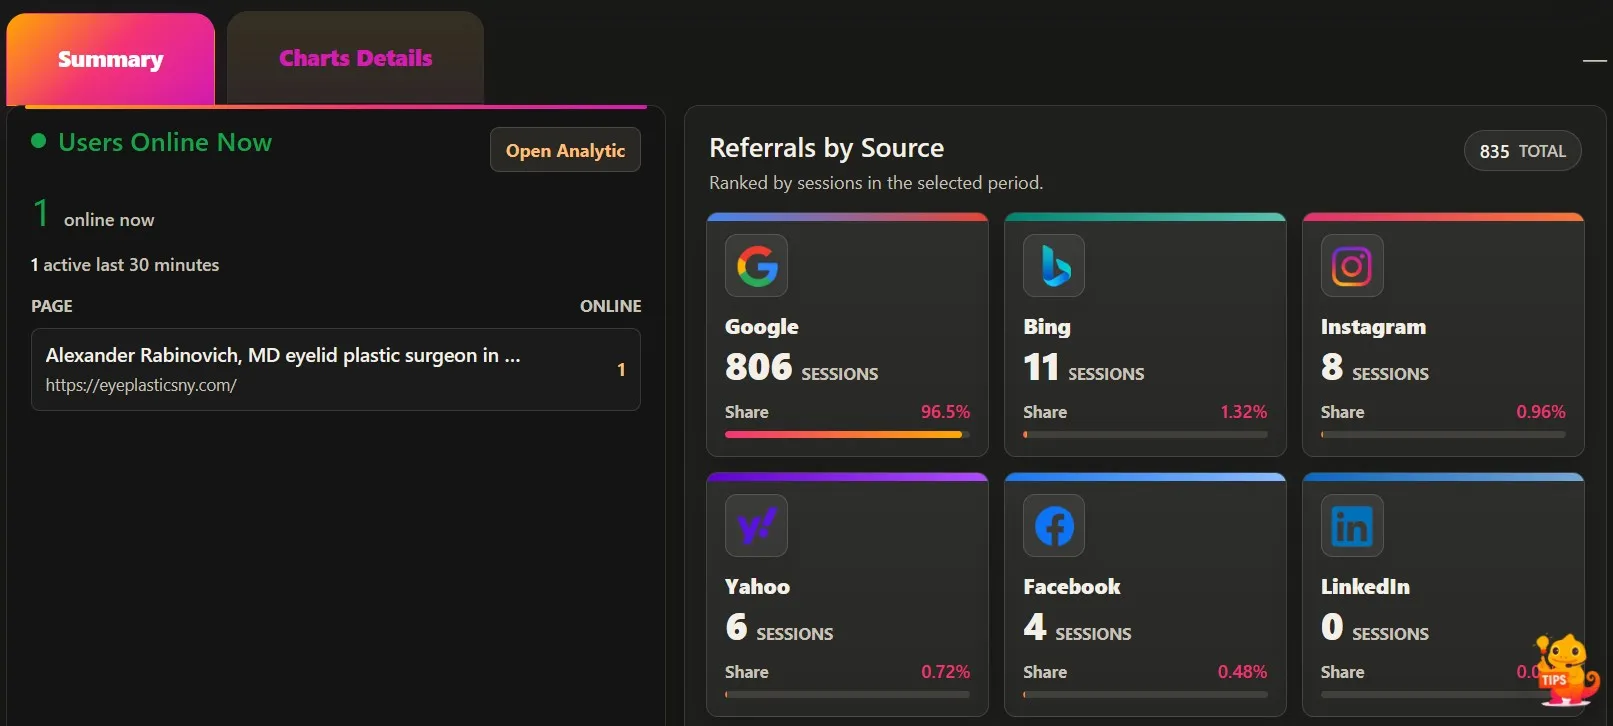
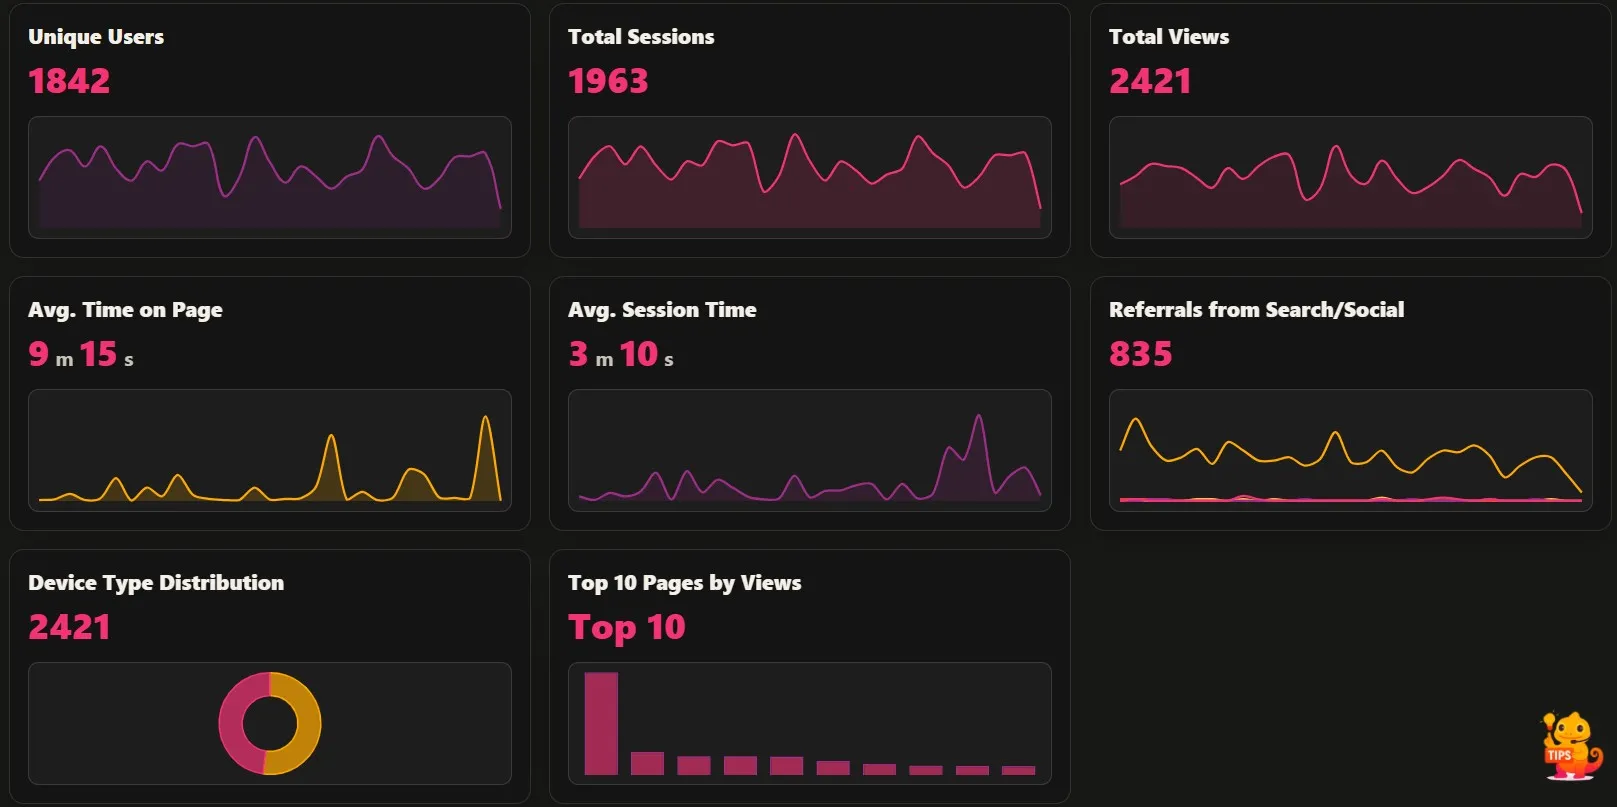
Most analytics tools tell you that something happened. WPMC Behavior & Heatmap is designed to help you understand where it happened, how visitors moved through the page, and which parts of the website actually received attention. Instead of treating behavior data as a separate report, the plugin brings these signals closer to the WordPress workflow, where content, layout, calls to action, and page structure can be reviewed together.
This makes the dashboard useful not only for checking numbers, but for asking better questions about your website. Are visitors noticing the sections you care about? Do important buttons attract real interaction? Are people leaving before they reach key content? The purpose of this demo is to show how those questions can become easier to explore inside a familiar WordPress-style interface.
This demo dashboard is a visual mockup of the WPMC Behavior & Heatmap admin experience. It does not show a live analytics account or real visitor data, but it reflects the general direction of the plugin: a focused WordPress dashboard for understanding how people interact with your website.
Use this preview to get a feel for the main workflow – from page-level behavior reports and visual heatmaps to scroll depth, referral sources, navigation clicks, conversion clicks, mouse trails, statistics, analytics, settings, and cleanup tools. The real plugin may look different as features evolve, but the goal stays the same: to turn visitor behavior into clear, useful signals directly inside WordPress.
Open demo dashboardDemo Dashboard Mockup Desktop preview only. On small screens, this mockup may display poorly.
×
 Website Uptime & Security Monitoring
for WordPress – 24/7
Website Uptime & Security Monitoring
for WordPress – 24/7
 Likes 0
 Comments 0
Search & Social Referrals
Separate search intent from social interest Search and social visitors usually arrive with different mindsets. Search often brings a question, while social often brings curiosity, timing, or a story that caught attention. What it helps you …
Page Performance Overview
A quick health check for each page Page performance is more than traffic. A useful overview combines views, attention, clicks, and engagement so you can quickly decide whether a page is strong, weak, or ready for a deeper review. What it he…
IP Exclusion
Ignore known internal traffic Known internal traffic should not decide what looks popular. IP Exclusion helps keep office, agency, client, or testing visits out of the behavior story. What it helps you understand IP Exclusion helps …
Leave a Comment
Comments